In this document, I outline the steps to set up a system to take NVIDIA GPU performance measurements. This could be required, for example, to analyze and improve the performance of an LLM.
This document is the converse of a friction log. I ran into many obstacles getting this to work, so I have noted here a least-friction, paved path to profiling NVIDIA GPUs.
High Level Outline
First, we use a remote VM in Google Cloud that is attached to an NVIDIA GPU.
Next, we set up NVIDIA profiling toolchain and our Python environment on our remote VM.
Finally, we take profiling measurements on our remote VM and analyze the measurements on our local desktop.
Step 1/3 Remote VM Setup
I use Google Cloud because it is easy to create a VM, attach fractional GPUs, and ssh into the VM afterwards.
Create a Google Cloud account, if you have not already. Create a project to house these experiments. Enable Compute Engine API on this project.
By default, you will have zero GPUs as your quota. Ask for an increase of gpus_all_regions quota. 1 should be enough for this experiment.
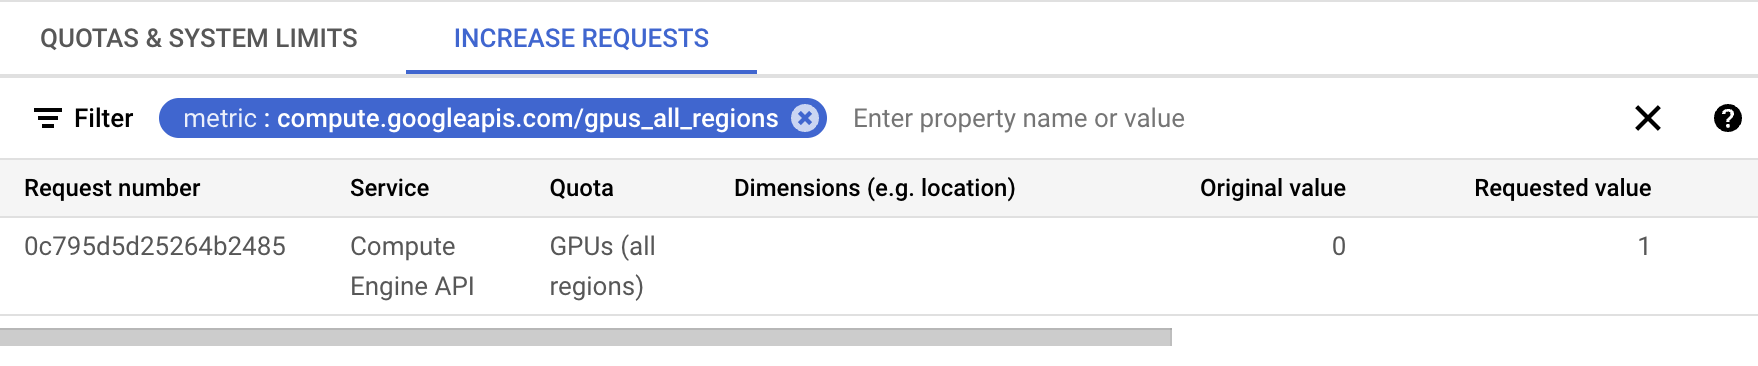
Note: For me, I got rejected when I created a project and then asked for a quota increase right away. But it worked for a different, older project. Your mileage may vary.
I created a VM to use for GPU profiling as follows:
When configuring, I clicked on the “GPUs” tab. I selected 1 GPU of type NVIDIA T4. I also selected a high-memory instance: n1-highmem-2, 2 vCPUs, 13GB memory.
Note: Having more memory helps with larger models. You can always start with a smaller instance size and change later, if you run into out-of-memory errors.
For the operating system, I selected “Ubuntu 24.04 LTS Accelerated”. This comes with NVIDIA CUDA drivers built-in.
Note: Choose an image that already has CUDA drivers.
I set disk size to 128GB.
I used a spot instance type to minimize costs. I enabled graceful termination, however.
Warning: A spot instance can be terminated by Google Cloud pre-emptively. I did not see any such terminations in the short periods of time I kept the instance up.
Next, I started the VM. I logged in to it from the browser-based SSH first, to note my user name. I then logged in from my terminal through ssh.
# Note: adjust the command below for your VM zone, your username, your VM name, and your project name
$ gcloud compute ssh --ssh-flag="-L 8887:127.0.0.1:8888" \
  --zone "us-central1-a"  \
  "n_deepak@deepakn-dsvm" \
  --project "news-digest-2024"
Note that I have set ssh to forward requests from localhost:8887 to the remote :8888 port. This allows me to access my remote Jupyter notebook from my local browser later. Jupyter also allows file uploads and downloads in its UI.
Inside the VM, verify that you have a GPU connected:
$ nvidia-smi
Sun Mar 16 18:09:36 2025
+-----------------------------------------------------------------------------------------+
| NVIDIA-SMI 550.144.03             Driver Version: 550.144.03     CUDA Version: 12.4     |
|-----------------------------------------+------------------------+----------------------+
| GPU  Name                 Persistence-M | Bus-Id          Disp.A | Volatile Uncorr. ECC |
| Fan  Temp   Perf          Pwr:Usage/Cap |           Memory-Usage | GPU-Util  Compute M. |
|                                         |                        |               MIG M. |
|=========================================+========================+======================|
|   0  Tesla T4                       Off |   00000000:00:04.0 Off |                    0 |
| N/A   38C    P8              9W /   70W |       1MiB /  15360MiB |      0%      Default |
|                                         |                        |                  N/A |
+-----------------------------------------+------------------------+----------------------+

+-----------------------------------------------------------------------------------------+
| Processes:                                                                              |
|  GPU   GI   CI        PID   Type   Process name                              GPU Memory |
|        ID   ID                                                               Usage      |
|=========================================================================================|
|  No running processes found                                                             |
+-----------------------------------------------------------------------------------------+
At this point, we have a VM on the cloud that is connected to an NVIDIA GPU. We can log in to the VM through ssh. Next, we will set up our GPU profiling environment toolchain on this system.
Step 2A/3 NVIDIA Profiling Toolchain Setup
We will use NVIDIA Nsight for profiling. As of this writing, it requires Nsight versions 2025.1 or later.
Warning: As of this writing, the VM image runs an older version of Nsight. It will fail with our notebook plugin. This is why we need to download a newer version separately.
We will install NVIDIA Nsight Systems and NVIDIA Nsight Compute.
Download Nsight Systems.
Note: Use the Linux version to download
To install:
wget https://developer.nvidia.com/downloads/assets/tools/secure/nsight-systems/2025_1/nsight-systems-2025.1.1_2025.1.1.131-1_amd64.deb
sudo apt update
sudo apt install ./nsight-systems-2025.1.1_2025.1.1.131-1_amd64.deb
Verify that we are using the latest version:
$ nsys --version
NVIDIA Nsight Systems version 2025.1.1.131-251135540420v0
Download Nsight Compute.
Note: Use the Linux version to download
To install:
wget https://developer.nvidia.com/downloads/assets/tools/secure/nsight-compute/2025_1_1/nsight-compute-linux-2025.1.1.2-35528883.run
sudo ./nsight-compute-linux-2025.1.1.2-35528883.run
After installing Nsight Compute, add it to the system path:
# add this line at the end of .bashrc in your home directory
export PATH=/usr/local/NVIDIA-Nsight-Compute:$PATH
By default, Nsight Compute is enabled for super-users only. To enable for everyone, we will provide a flag to the relevant kernel module. See ERR_NVGPUCTRPERM.
sudo su -c \
  'echo modprobe nvidia NVreg_RestrictProfilingToAdminUsers=0 > /etc/modprobe.d/nvidia.conf'
Restart the virtual machine for the configuration changes to take effect, and verify that Nsight Compute works:
$ sudo reboot
# wait some time, reconnect via ssh
# within ssh session:
$ which ncu
/usr/local/NVIDIA-Nsight-Compute/ncu
At this point, we have the NVIDIA performance tools set up. Next, we will set up our Python and notebook environment.
Step 2B/3 Python Environment Setup
Generally, I do not meddle with the system-wide Python distribution. I prefer uv to set up my Python environment.
To install uv:
$ curl -LsSf https://astral.sh/uv/install.sh | sh
$ source $HOME/.local/bin/env
We will create a directory to house our Jupyter notebook and profiling artifacts. We will then create a Python virtual environment there.
mkdir -p dev/gpuprof
cd dev/gpuprof
# create a virtual environment
uv venv
# activate the virtual environment
source .venv/bin/activate
Inside the virtual environment, let’s install a few required libraries:
# Deep learning libraries and frameworks
uv pip install torch transformers
# Jupyter and profiling extensions to Jupyter
uv pip install jupyter jupyterlab-nvidia-nsight nvtx
Now let us start Jupyter Lab:
$ uv run --with jupyter jupyter lab
Warning: Simply running
jupyterwill run the system-wide Jupyter. Useuv runas above instead.
Note down the token URL, looks like this:
http://127.0.0.1:8888/lab?token=effd8bf487a626d53e718ae485bfb0d5a686069ac42486bf
On your local desktop, paste the URL to your browser, change the port to 8887, and click Go:
http://127.0.0.1:8887/lab?token=effd8bf487a626d53e718ae485bfb0d5a686069ac42486bf
The request will automatically be forwarded to the remote Jupyter server through the ssh connection we already have open.
In a few seconds, you should see your remote Jupyter environment on your browser.
Warning: The ssh connection should remain open while you work on the Jupyter notebook, because it tunnels communications between your local browser and the remote Jupyter server.
Next, we will import a notebook and take profiling measurements.
Step 3A/3 Take Profiling Measurements
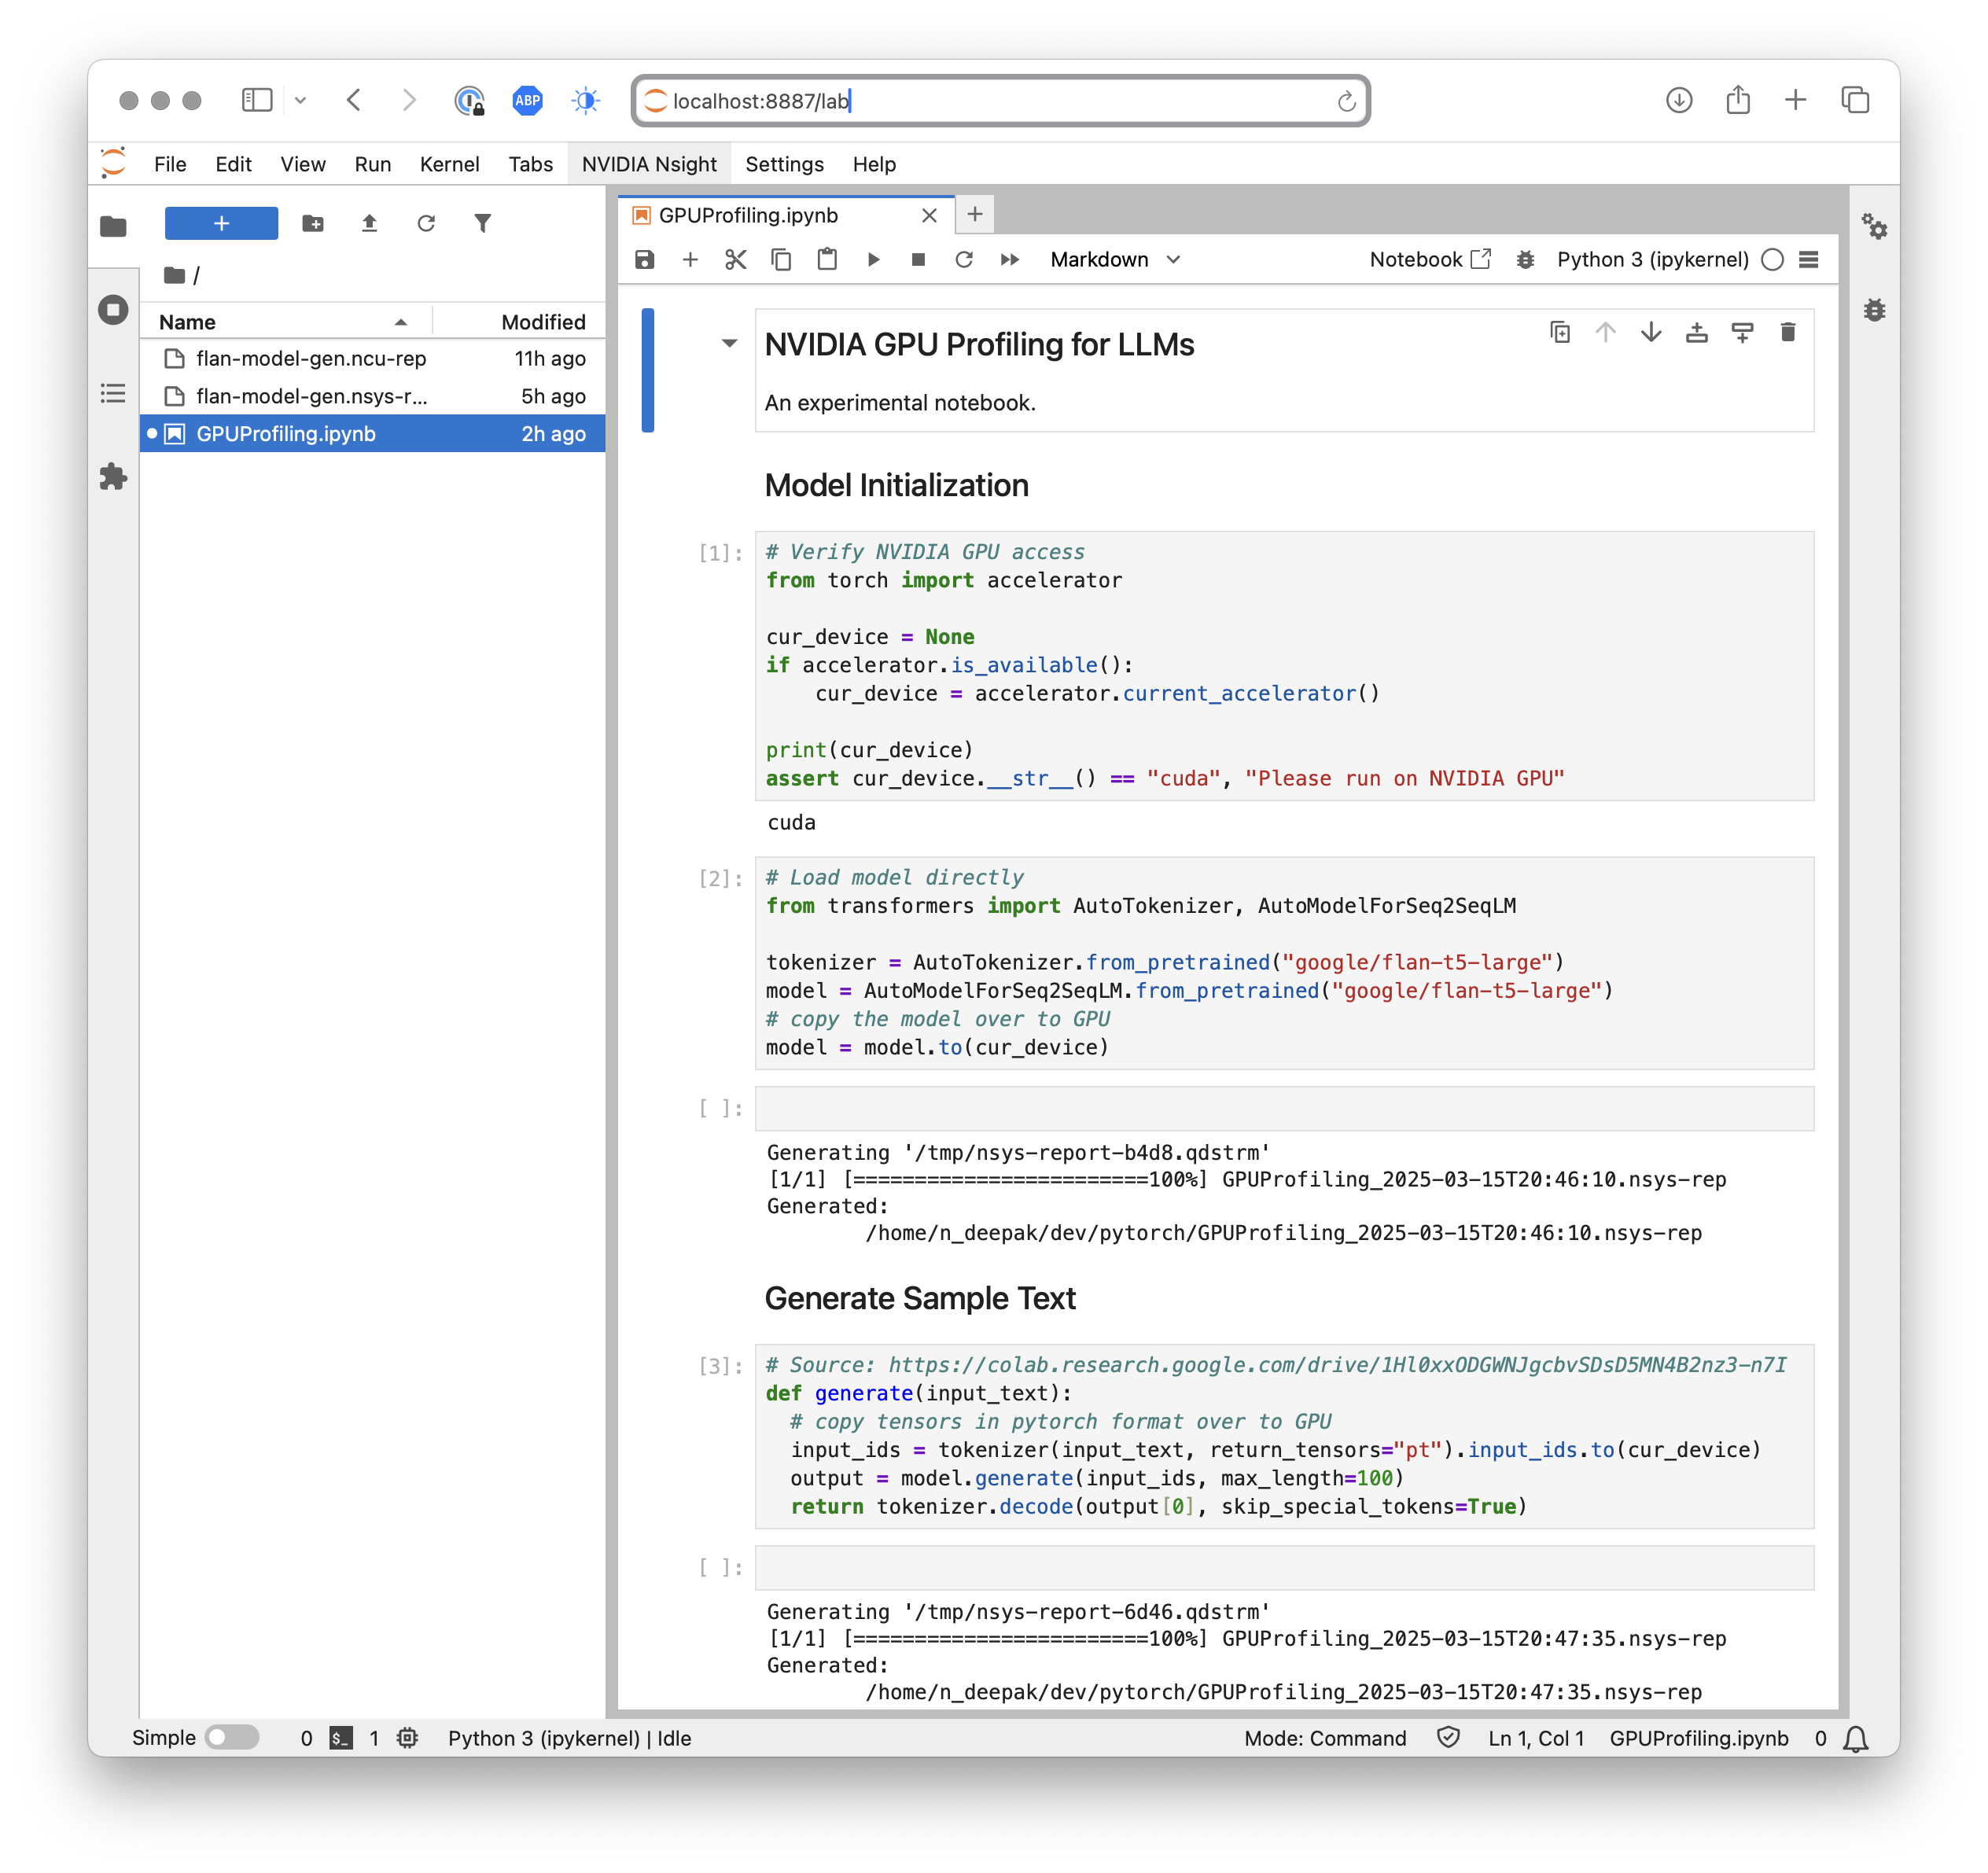
We will use a Google FLAN T5-Large model for our profiling. We will load the model to the GPU and ask a simple question.
You can import the notebook I used. We want to profile the last block, which actually runs inference on the model by asking it to generate the answer for a question.
Jupyter will have a menu for “NVIDIA Nsight” that allows you to take measurements with either tool (only Systems or Compute can be used at a time).
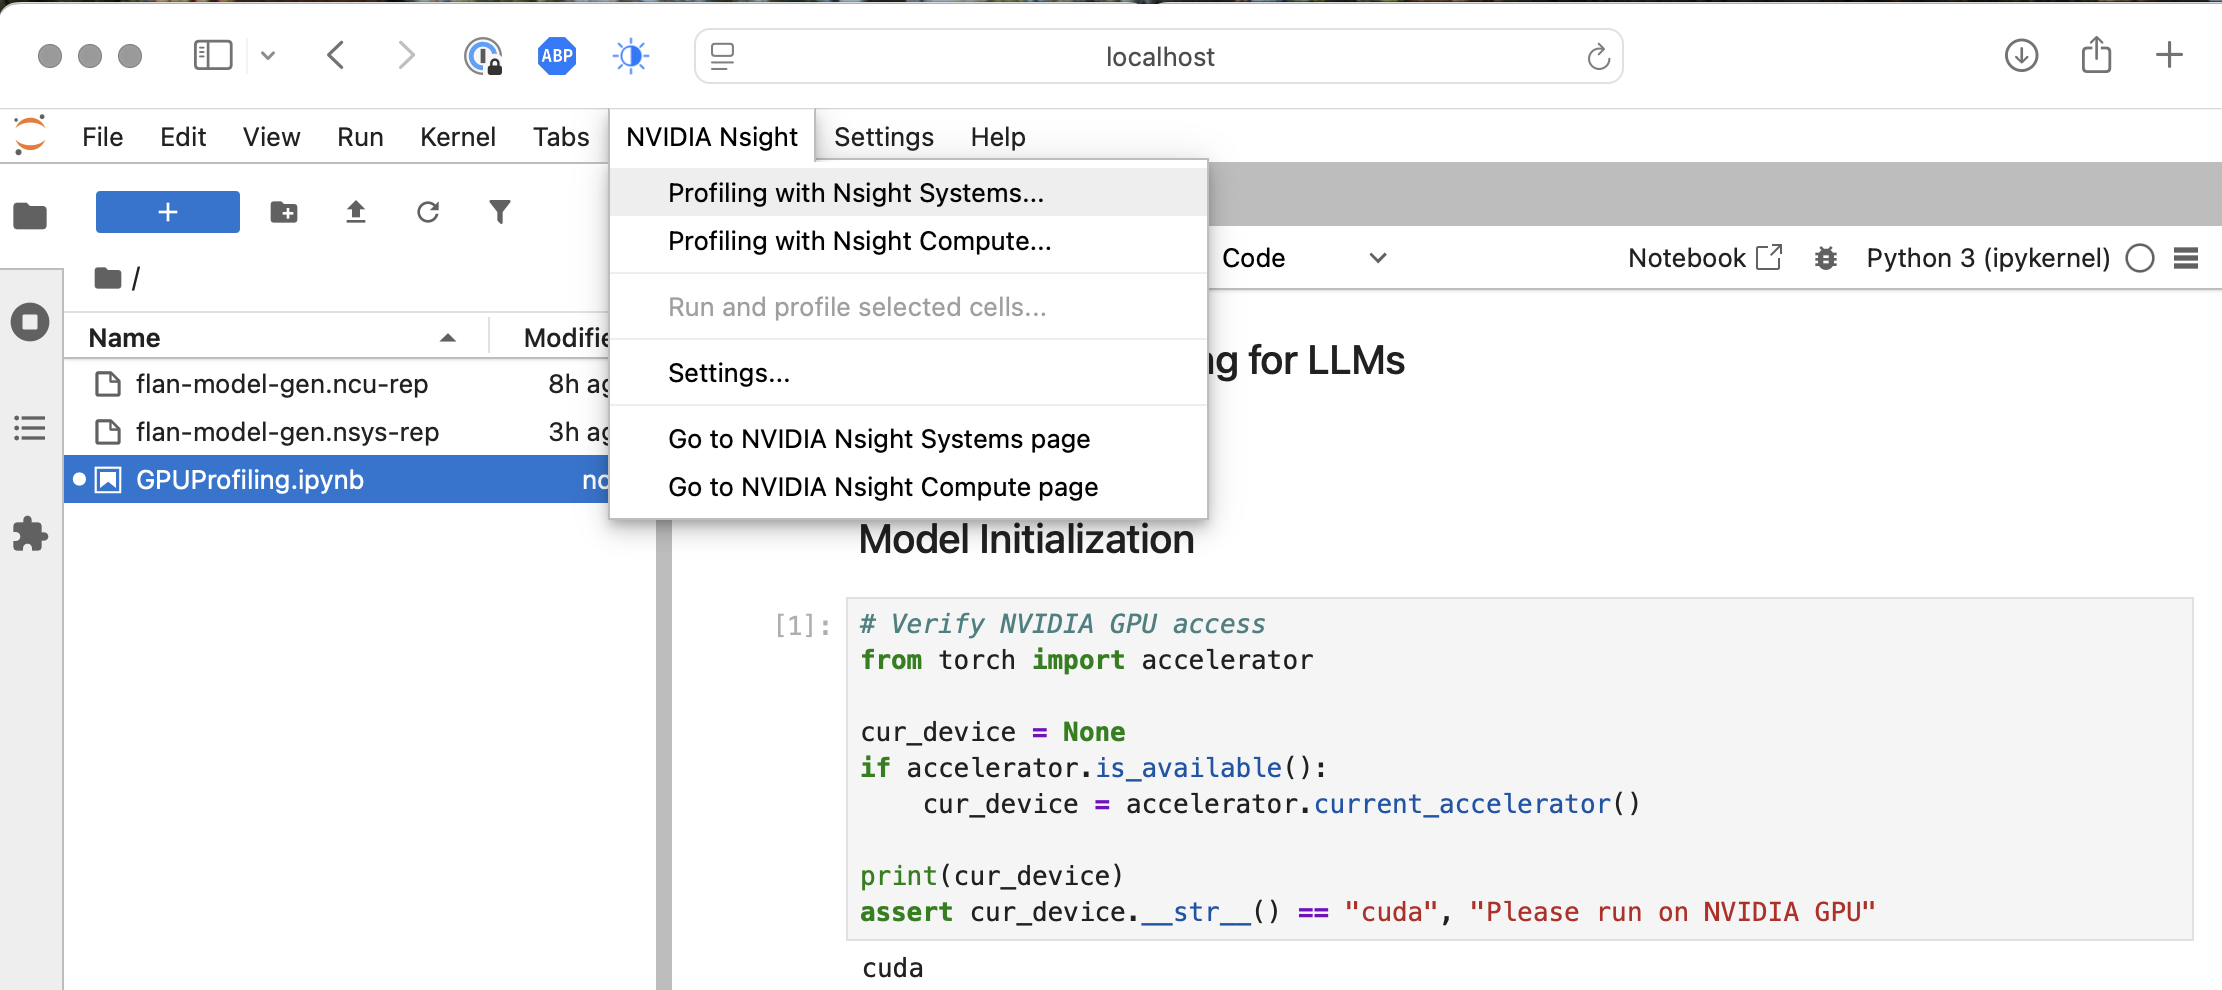
When I clicked on “Profiling with NVIDIA Nsight Systems…”, it showed an additional dialog box. I went with the defaults, and it showed a new green “Play” button at the top:
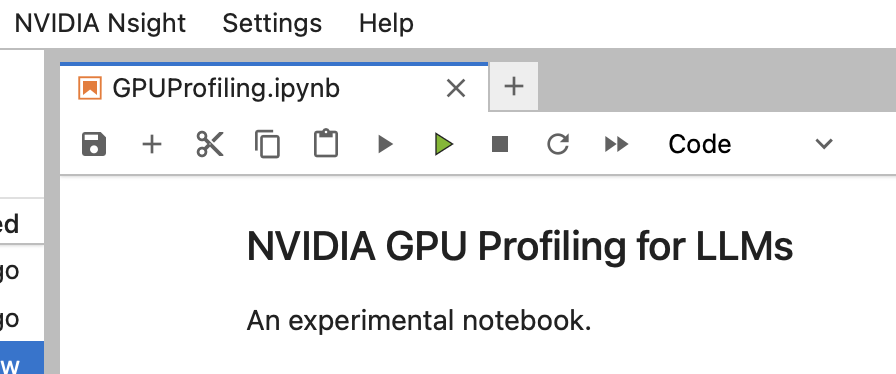
To profile, I clicked the usual grey play button on most of my notebook blocks. For the block I wanted to profile, I clicked the green Play button. Within a few seconds, it created a <name-timestamp>.nsys-rep file with measurements.
To profile with Nsight Compute, the steps are similar. It takes a long time, however. For my model, it took almost 5 hours to take the measurements and generate a <name-timestamp>.ncu-rep file with measurements. This file was about half a gig in size.
Warning: I repeat: this step can take hours.
We now have the profiling measurements. Next, we will analyze them!
Step 3B/3 Analyze Profiling Output
To analyze the measurements taken and identify some performance bottlenecks, download the measurement files generated above. Install Nsight Systems and Nsight Compute on your local desktop, so that you can explore the results graphically.
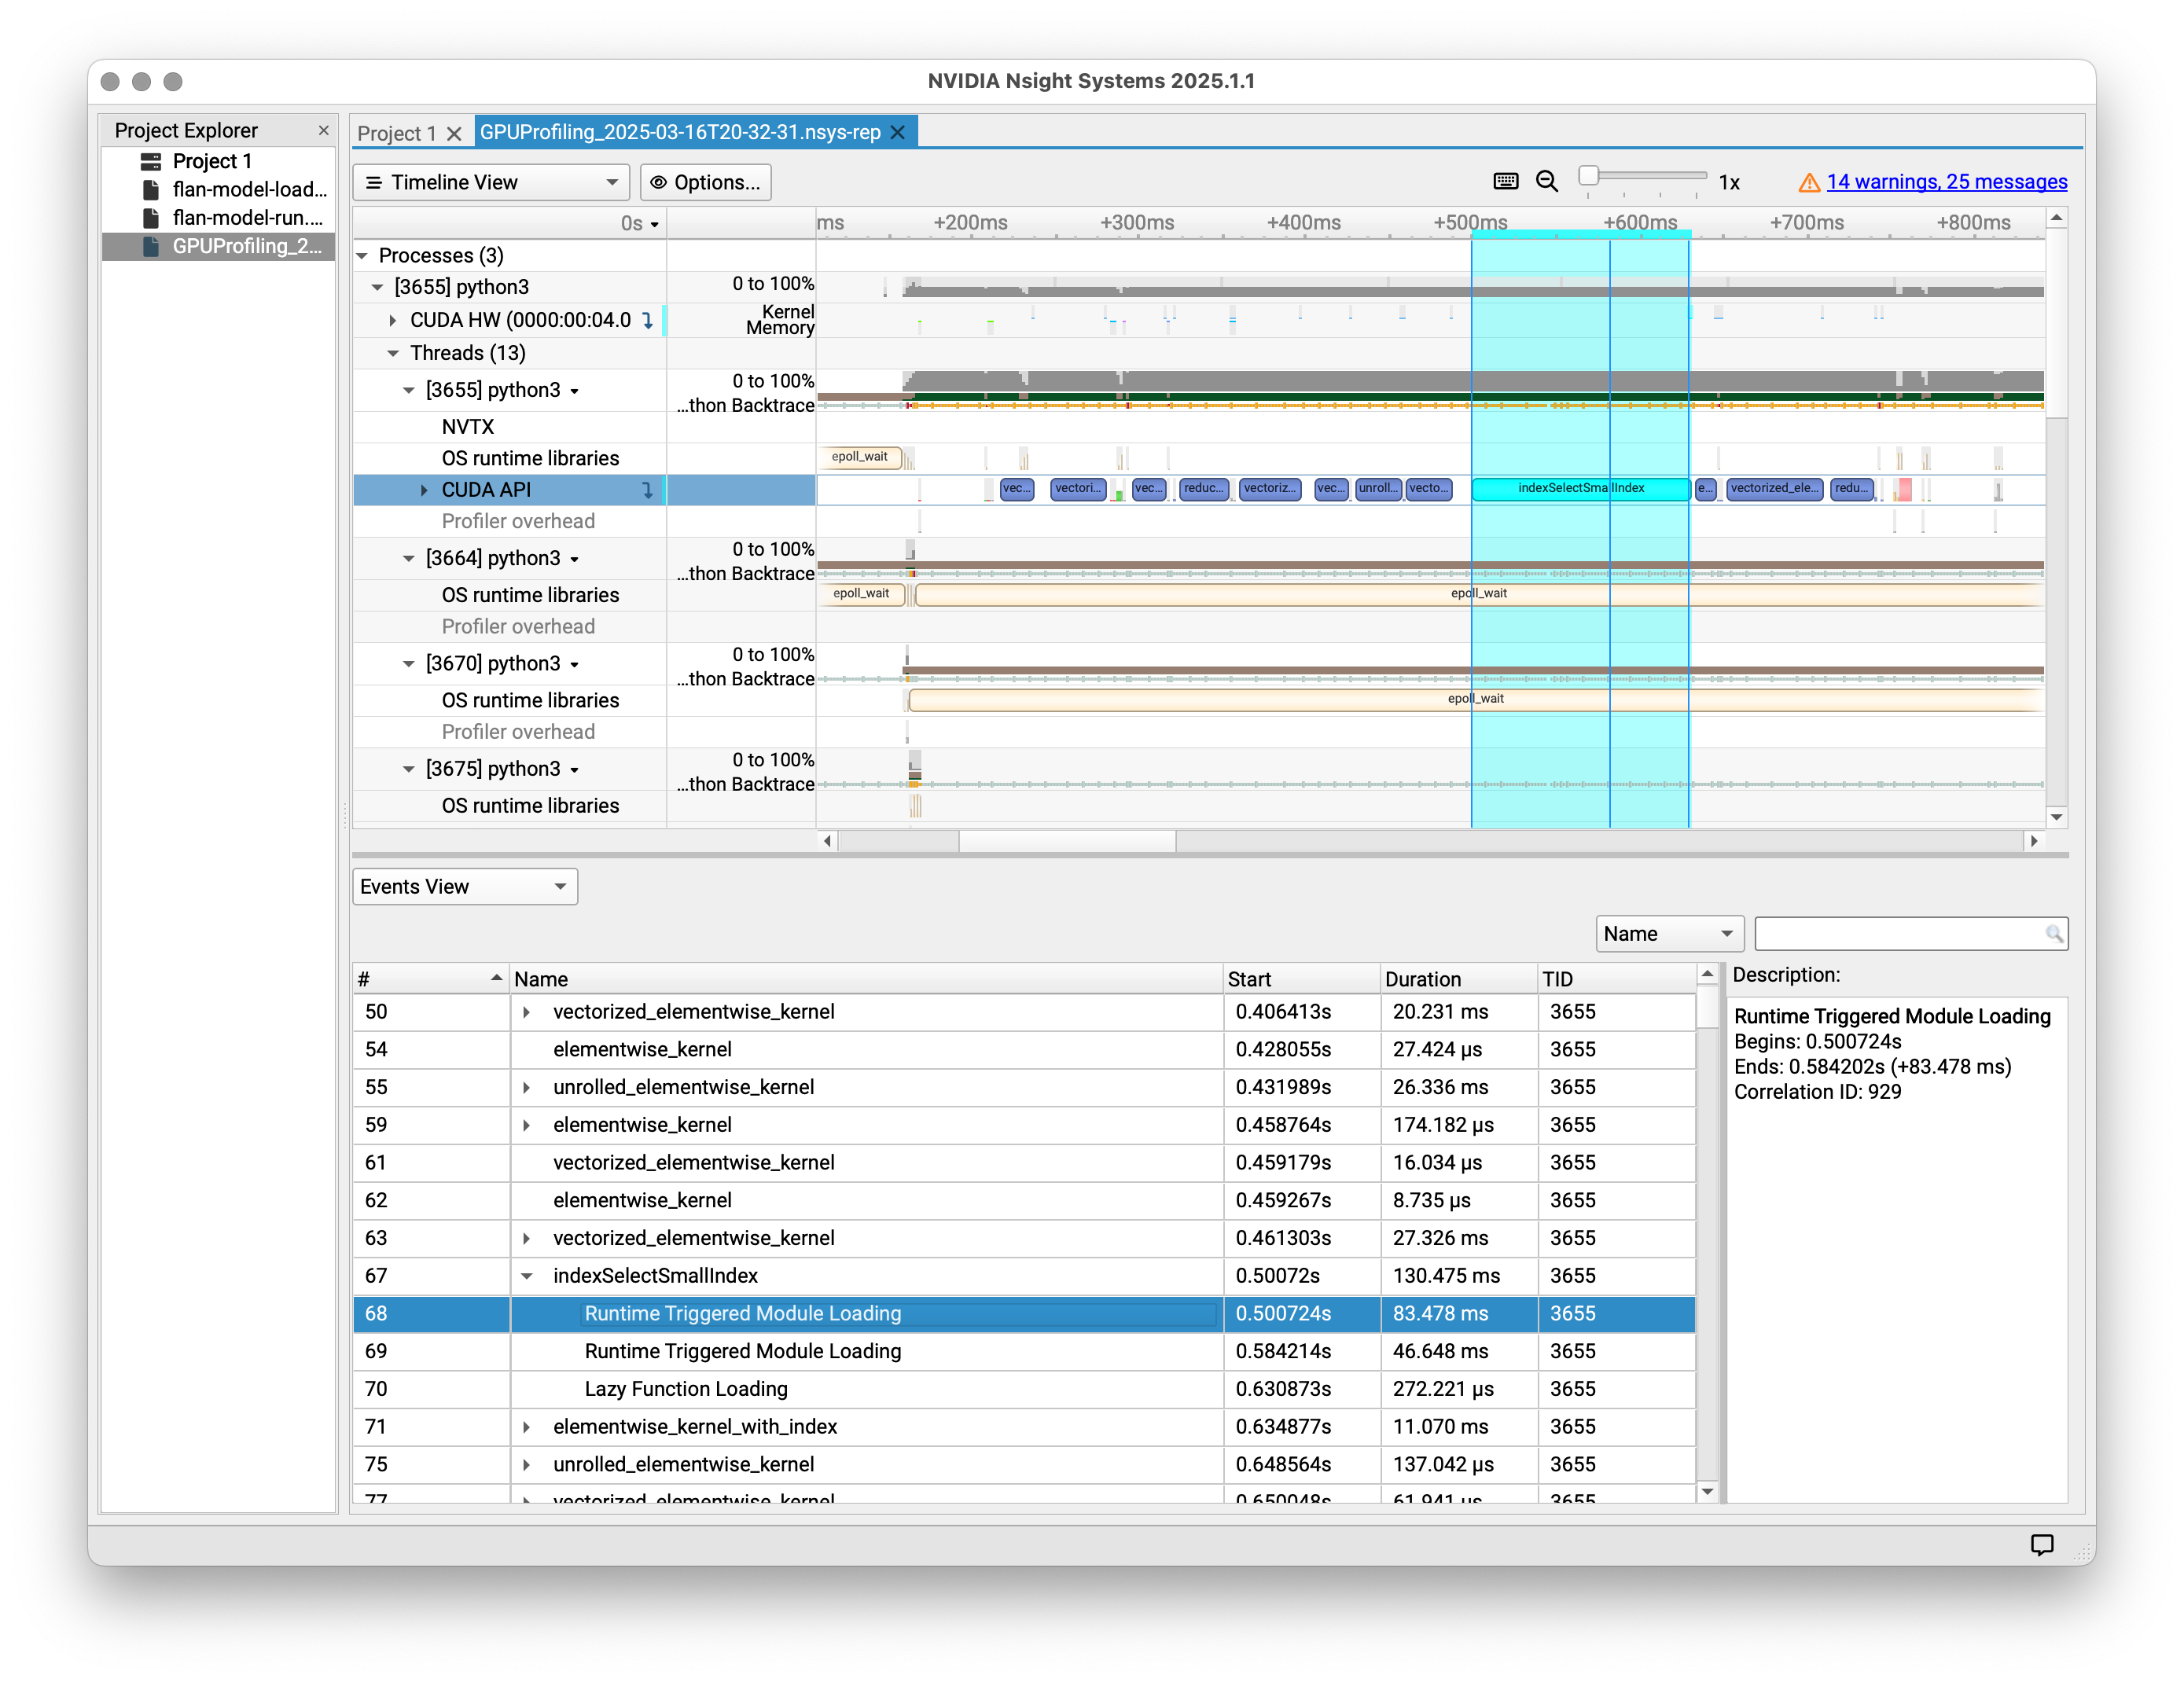
Here is how the UI looked for me for Nsight Systems.
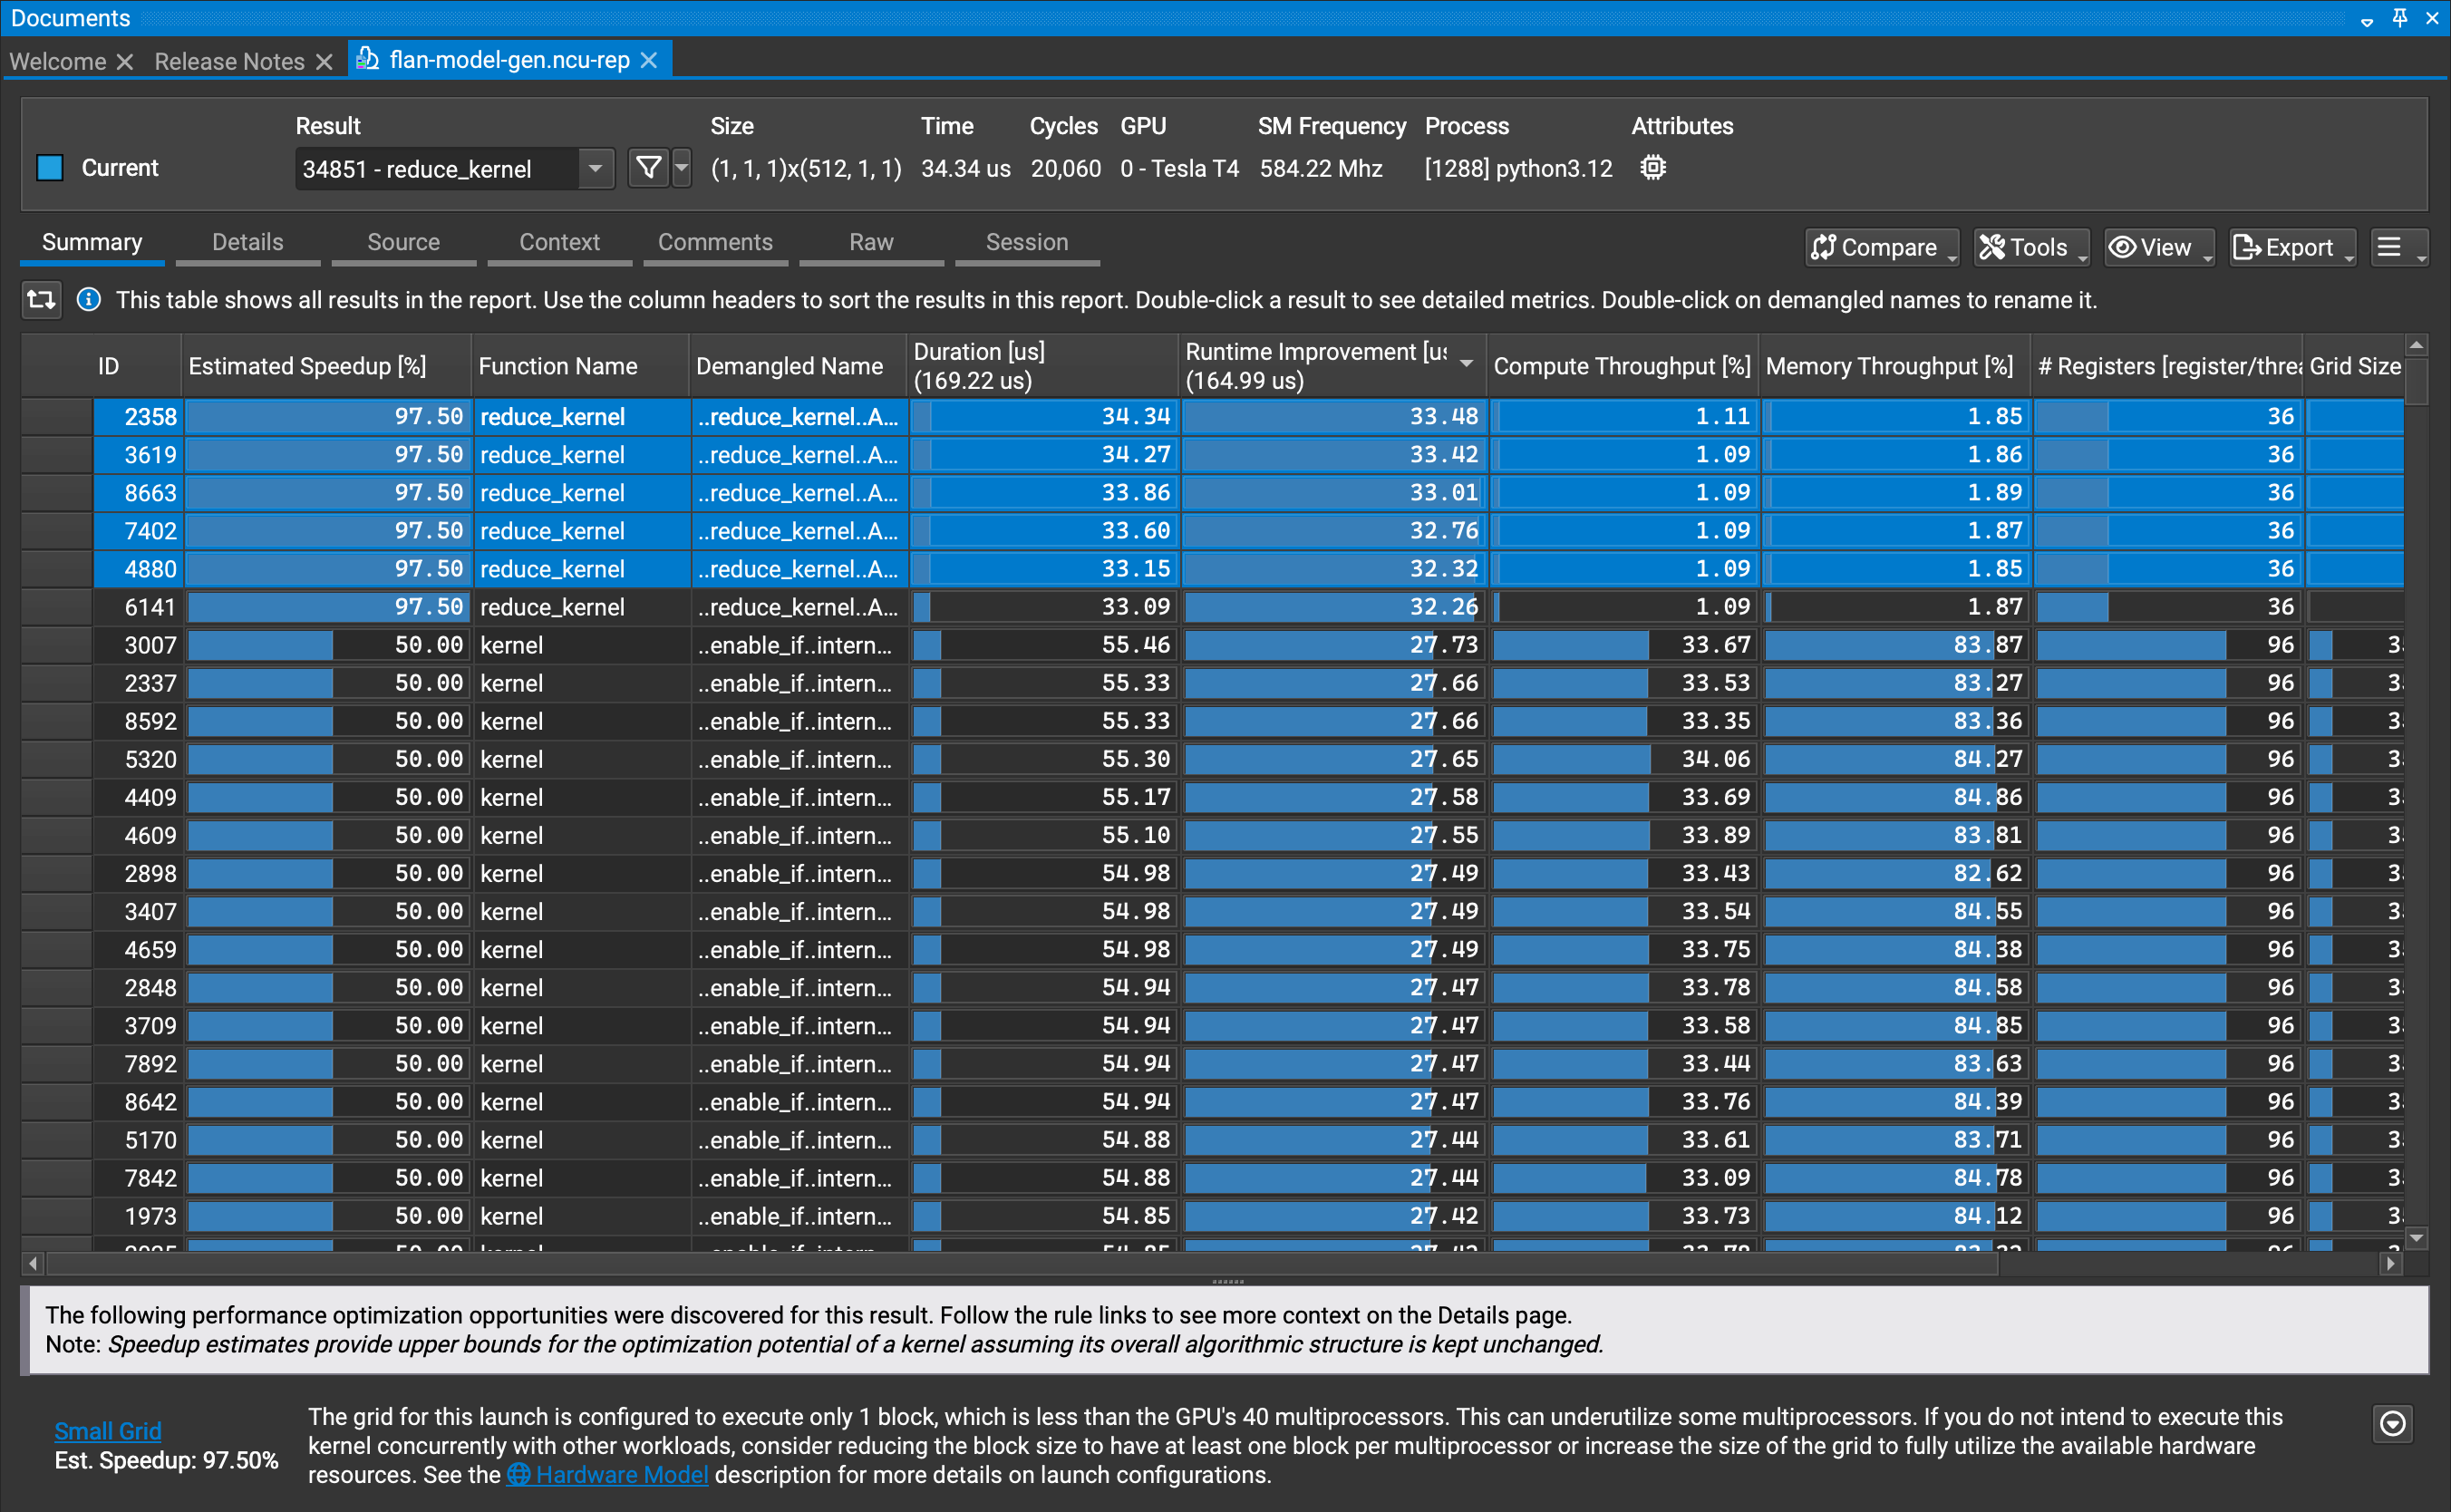
Here is how the UI looked for me for Nsight Compute. I have sorted the table by the most absolute improvement possible. There are many cases where we are not using all of the processing units (SMs) within the GPU. The overall occupancy is low, at about 20%.
Conclusion
This document noted a paved path to profile NVIDIA GPUs for performance optimizations. My hope is that it reduces the amount of friction research scientists face in getting this to work, and also foster better collaboration between ML research and engineering.