Hailstorms can pose a problem, if you’re installing solar panels. Large hailstones, those that are 2 inches wide or larger, can damage solar panels.
If you are solar panel provider, you typically want to play it safe and install where there has been no hailstorms, historically.
Large Hail and Solar Panels Don’t Mix
In the US, NOAA provides a severe weather dataset that also includes hailstorm events. Helpfully for us, the hail dataset also includes hail size.
I looked at years 1995-2020, and drew a heat map:
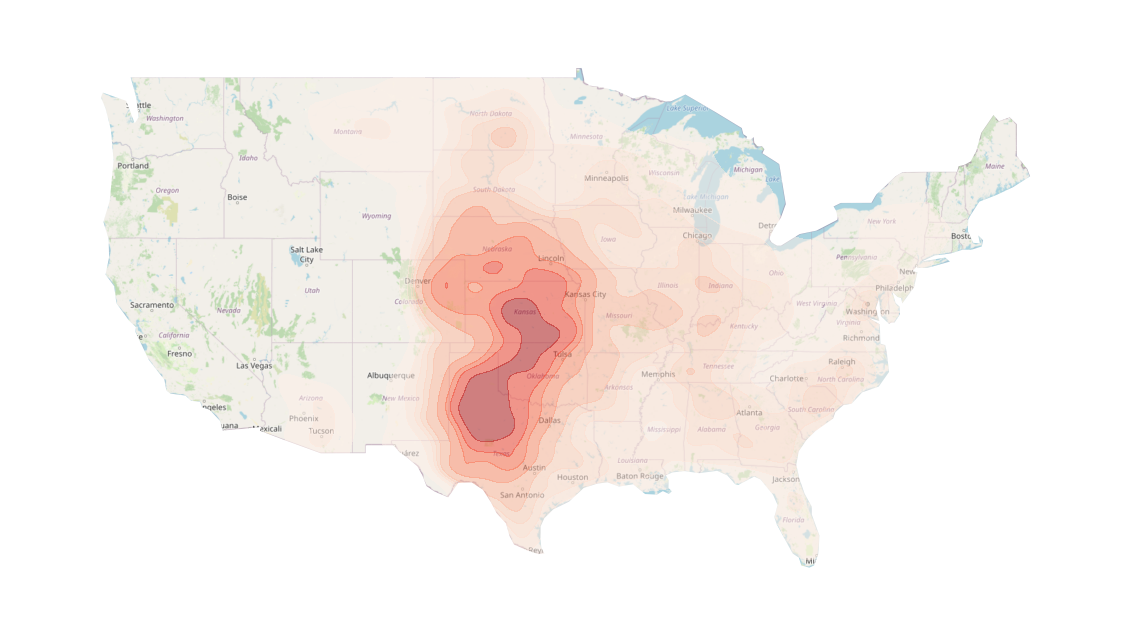
The map shows where such large hail are most likely to occur. They are the great plains of central US. Interestingly to me, there is also some chance of this occurring in the hot desert of southern Arizona – a region a solar panel company would probably be thinking about.
How I Built It
The dataset CSV files are available on NOAA website. The dataset is large - about 12GB in size.
I used Spark to read the large dataset and whittle it down by hail size. I converted the smaller dataset into a Pandas dataframe, and then to a Geopandas geodataframe. Finally, I used Geoplot’s kernel density estimation plot to get the above map.
There’s More
Just for fun, I wanted to see how the distribution looked for US counties. This is easier to do on Earth Engine. I used TIGER dataset for county boundary vectors, and counted hailstorms per county.
To do this, I brought the two datasets together with a spatial-join using the “intersects” operation. I then did a count by county, similar in SQL to a SELECT COUNT(*) FROM DATASET GROUP BY COUNTY.
Here is how the county-based map looks.
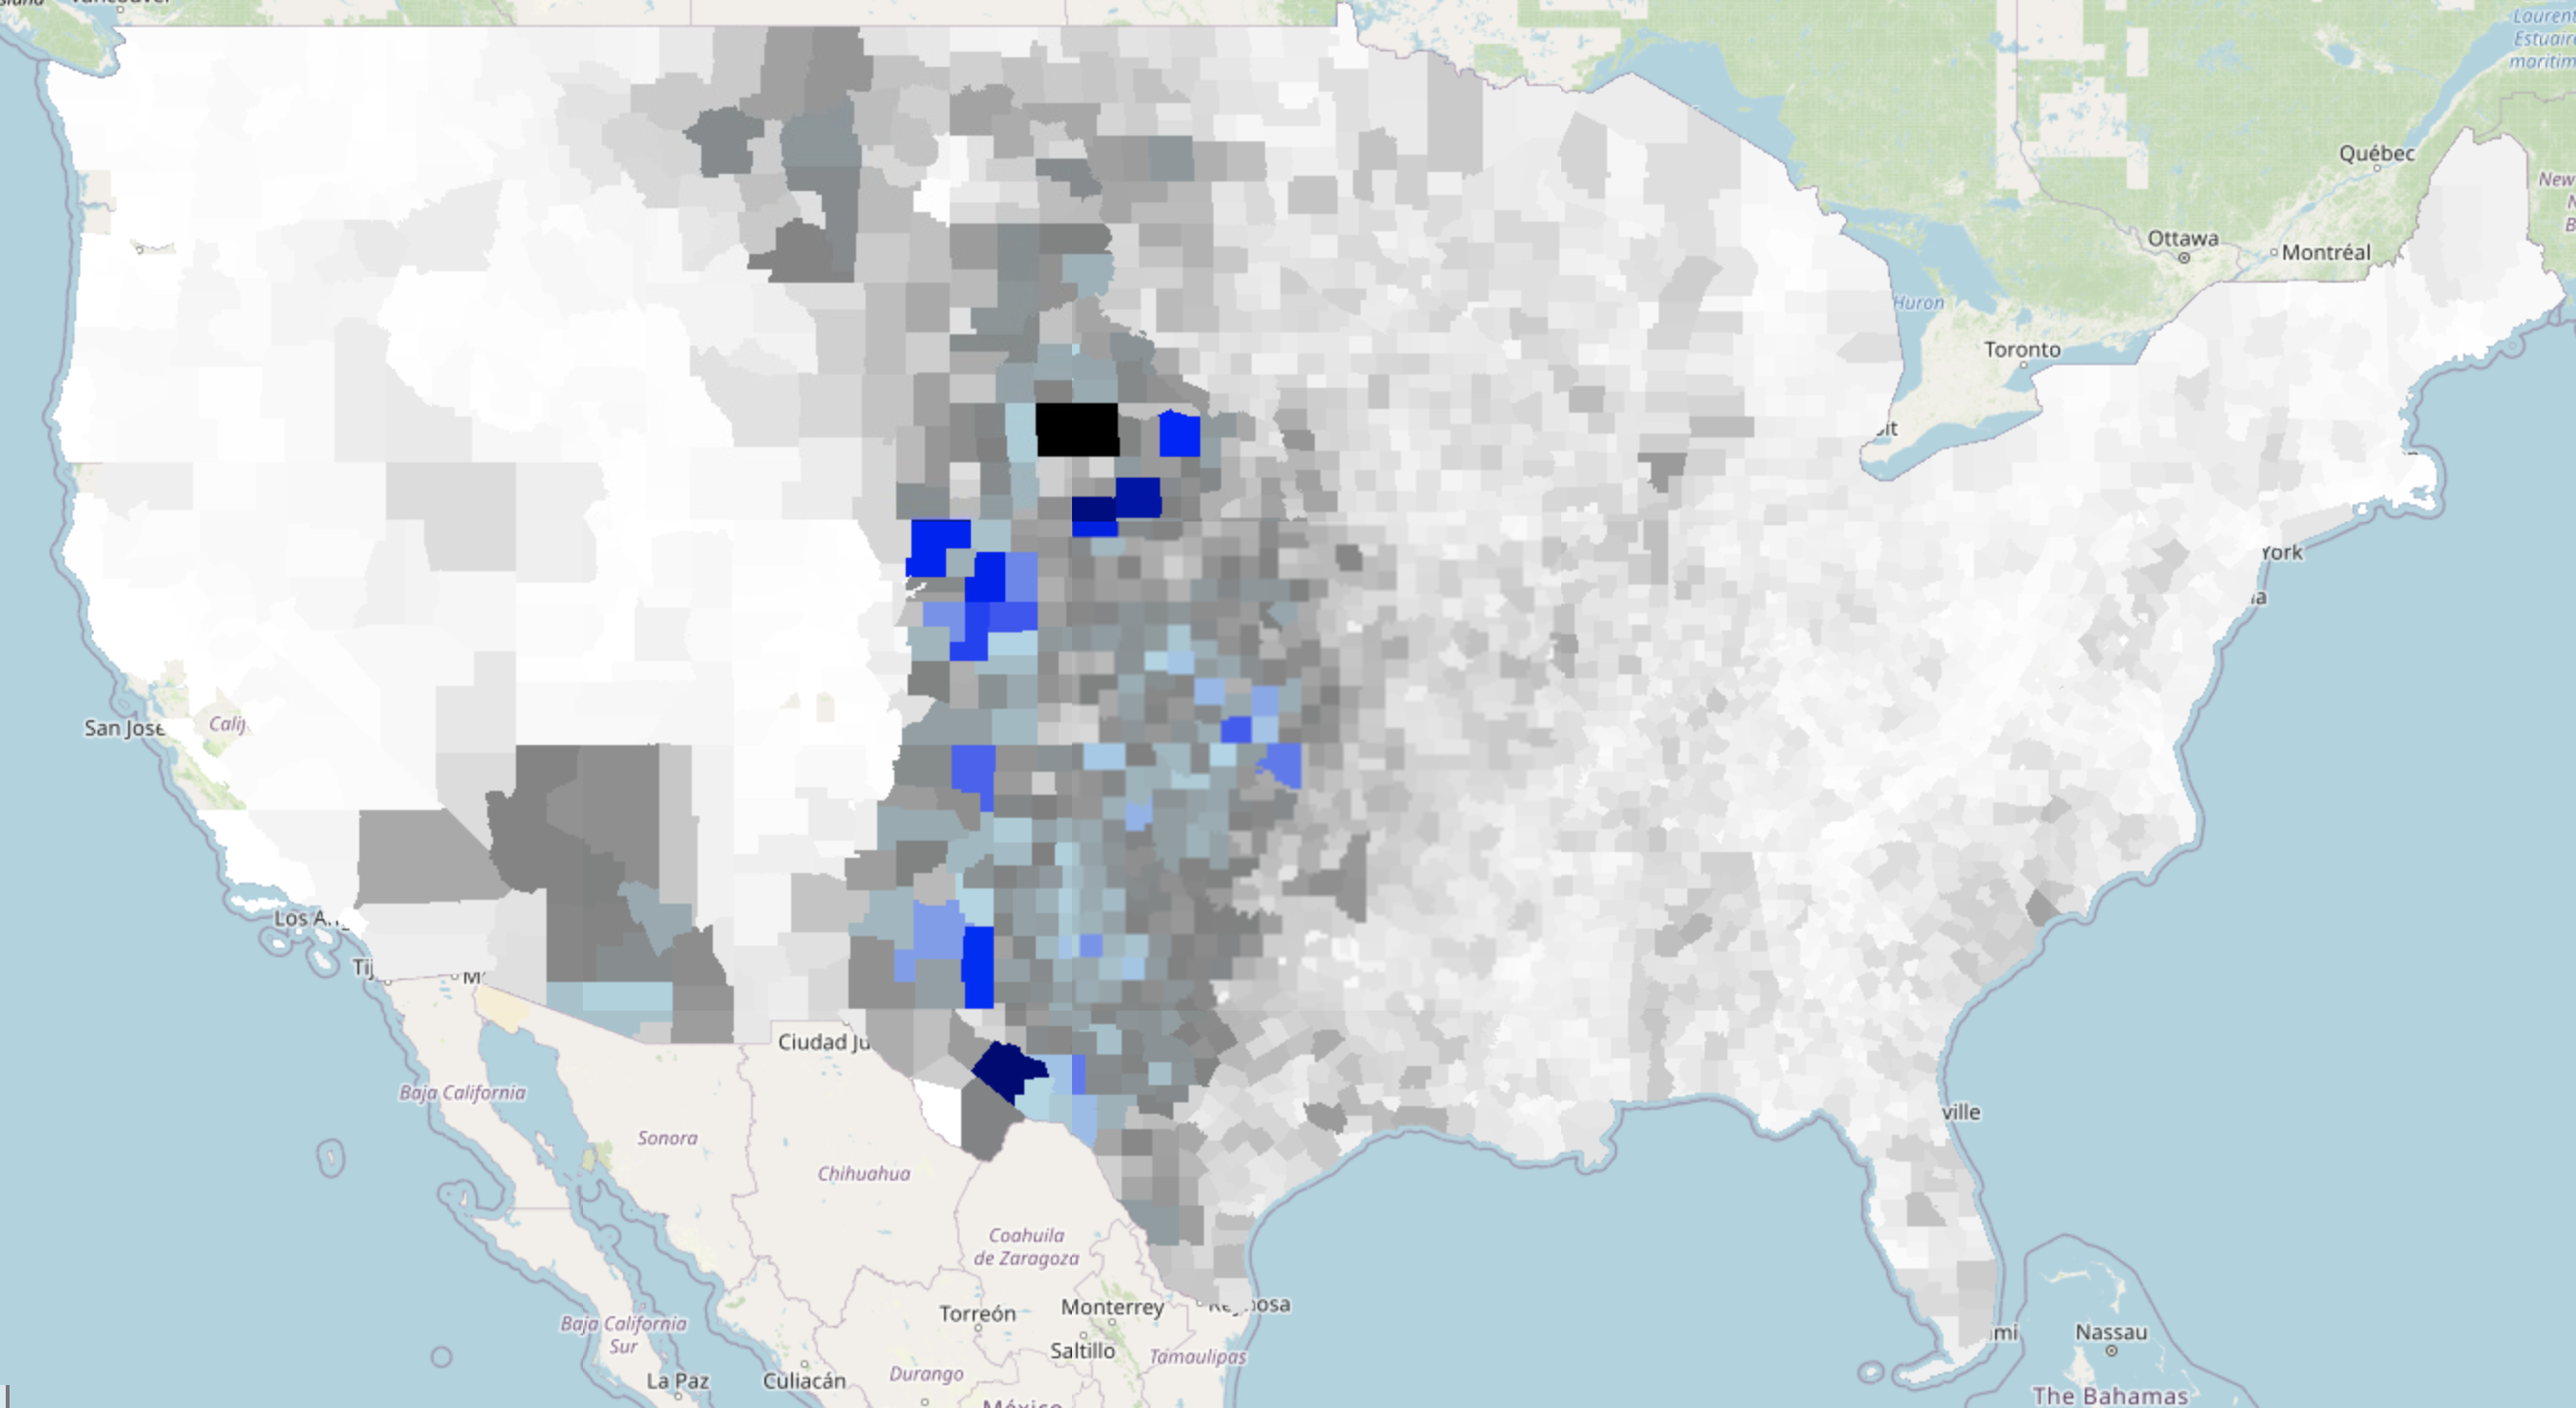
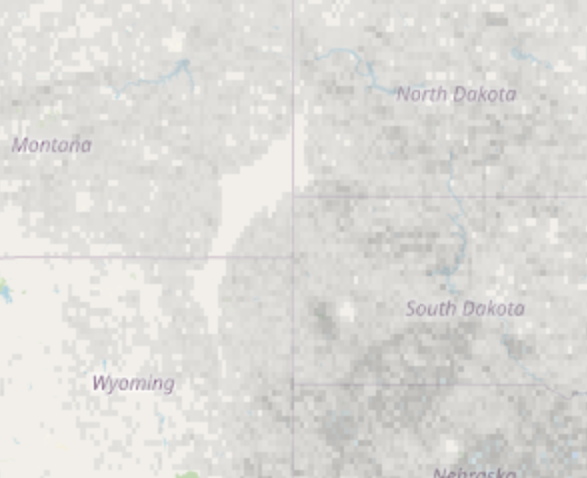
If you’re thinking that’s a bit artificial, because some counties are huge, you’re right. So, instead of counties, we can build a map that uses a grid of 0.25°, or even 0.1° resolution. Here’s how it would look for the state of Colorado:
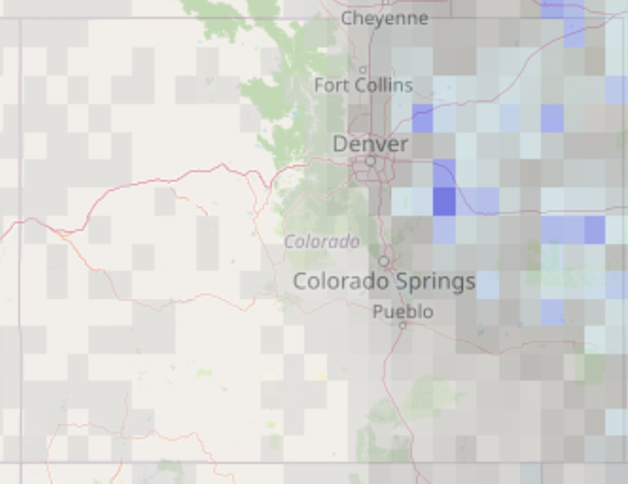
With such a map, you can actually see which regions of the US have had zero large hailstorms in the last 20 years, and if you are a solar panel company, plan your installation in one of those regions, far enough from the grey pixels.
Data Caveats
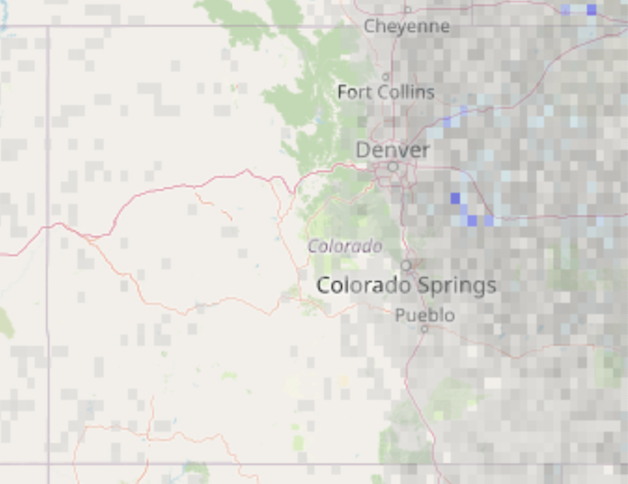
It’s important to note uncertainties about the maps we created. The hail dataset is not ground truth, but an approximation: a RADAR instrument “detects” hail with a certain probability. These RADAR instruments are geographically distributed and there are gaps in coverage. You can see their circular coverage patterns, gap in coverage where there is no overlap, and also another gap in the “eye” of the RADAR instruments, from a section of the 0.1° map below:
This means you have to be careful about map showing no hailstorm because of lack of detection, rather than actual lack of hailstorms.
The Importance of End-to-End Solution
This post is an example of a business problem: “As a solar panel company, where should I install my solar panel to minimize hail damage?” We translated it into a data-science question: where has hailstorm never occurred in the US in the last 20 years? We then translated it back into a business answer: you should probably look at these regions.
This is an end-to-end data project, and it needs talent in data engineering, data and geospatial data science, software engineering and functional programming, and business acumen. In large companies, there tends to be separate silos for each of these talents and much is lost in translation.